Build your own food-industry tools. No code, just plain English.
Describe the tracker or calculator you wish you had, and an AI builds it for you — no code, no developer, no software subscription.
Four prototypes you can try right now — nothing to install · 100 copy-and-paste prompts · a 15-minute setup guide.
From Mike Lee — food futurist, author of Mise, founder of The Future Market.

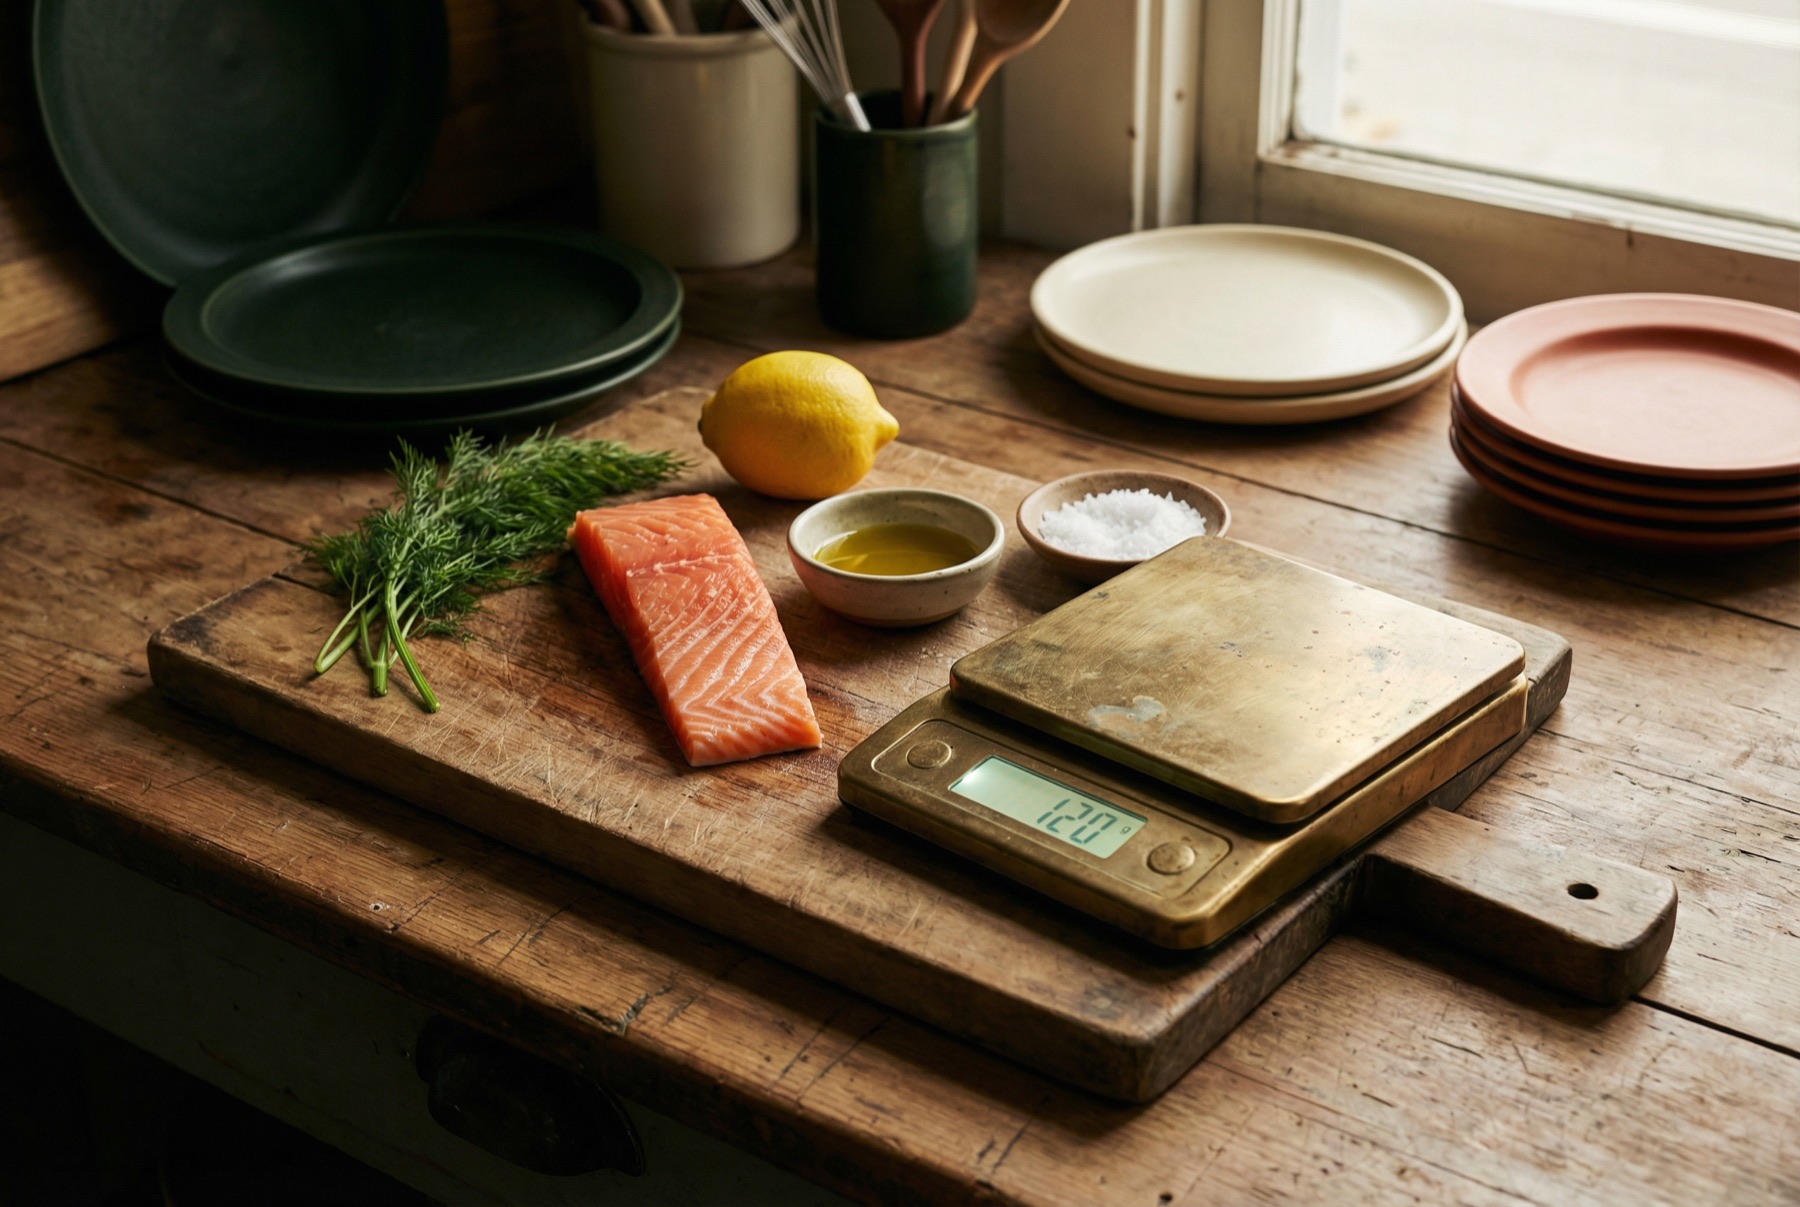
Click any prototype below — it opens right here in your browser, no sign-up needed. The data is made up; the point is to show what's possible.
Like what you see? Build your own version with your real numbers — your menu, your suppliers, your fields. It's a one-time 15-minute setup, then you copy a prompt and paste it in. Every tool runs entirely in your own browser, so the numbers you enter stay on your computer. New here? Start with the Setup Guide, then browse the 100 Prompts for your corner of food — restaurants, kitchens, CPG, farms, distribution, retail, catering, and more.
A vibecoded tool is real software, and real software can leak. Before your tool touches real data — or anyone besides you — run the five-minute check on the Security page. One copy-paste prompt, a plain-English report, no security degree required.
Beyond the four prototypes, there are ten ready-to-paste prompts for each of ten corners of food — restaurants, kitchens, CPG brands, farms, distribution, food safety, grocery, catering, data, and sustainability. Find the one closest to your work and you've got a starting point.